About this Project
A 2016 -2020 collaborative research project developed a 3D surge-wave model to examine how Piermont Marsh buffers storm impacts for the adjacent Piermont Village, New York. To inform model development, the team measured the physical attributes of the two primary vegetation types in the marsh - Typha (cattails) and Phragmites (common reed) - and continuously measured water levels at the edge of Piermont marsh. The surge-wave model was used to predict wave and flood height under a series of hypothetical future scenarios as well as Superstorm Sandy, which occurred in 2012. The future scenarios were designed around a proposed plan to restore native vegetation within a small section of Piermont Marsh through a phased approach.
About these datasets
Three project datasets have been archived with the NERRS Centralized Data Management Office and can be requested through individual data requests forms. For additional details, see: Dataset Description
Hydrologic Data: Observed Water Level in Sparkill Creek
- This dataset includes observed water level at a dock located on the Sparkill Creek (Piermont, NY) recorded during high water level events occurring over a span of ~7 months using a pressure sensor and an experimental radar sensor.
- Contact for Hydrologic Data: Justin Davis, University of Florida, Email: [email protected]
- Request this dataset
Vegetation Data: Marsh Vegetation and Plant Dimensions
- This dataset includes herbaceous marsh vegetation data from two marsh sites along the Hudson River, NY - Iona Marsh and Piermont Marsh. Plant stem density and physical plant dimensions were measured by hand and with a Riegl 400 terrestrial laser scanner.
- Contact for Vegetation Data: Christine Angelini, University of Florida, Email: [email protected]
- Request this dataset
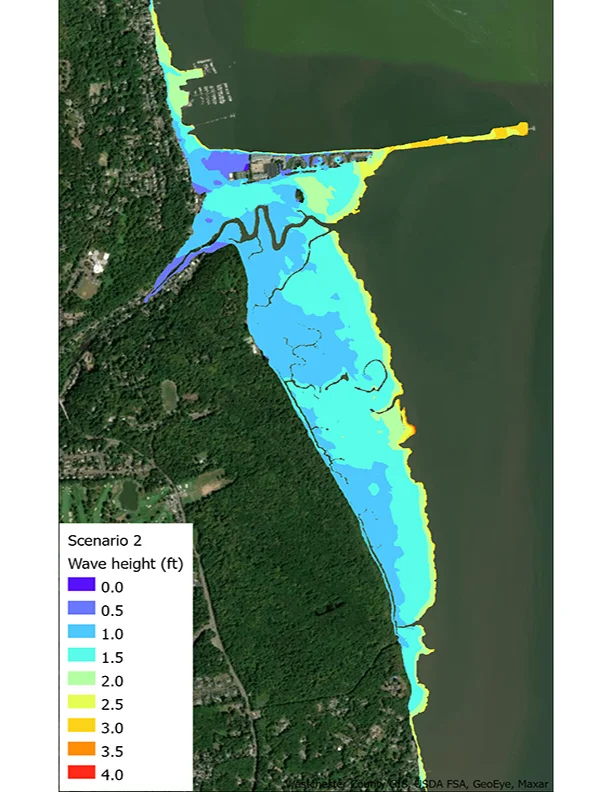
Flood and Wave Maps: Model Generated Flood and Wave Height Maps
- These are model generated maps of the predicted 1% flood (0.01 annual exceedance probability) and the predicted 1% wave height (0.01 annual exceedance probability) for 7 scenarios that mimic different stages of marsh management and future projections of sea level rise.
- Contact for Flood and Wave Maps: Y. Peter Sheng, University of Florida, Email: [email protected]
- Request this dataset
Project Lead and Contact for Project Questions:
Y. Peter Sheng, University of Florida, Email: [email protected]