The Habitat Heartbeats project is developing a monitoring system to integrate living organisms such as oysters and mussels ("biosentinels”) with existing monitoring efforts. This responds to a regional need to better understand water quality threats the biotic community and determine how estuaries respond to environmental variation and human impacts.
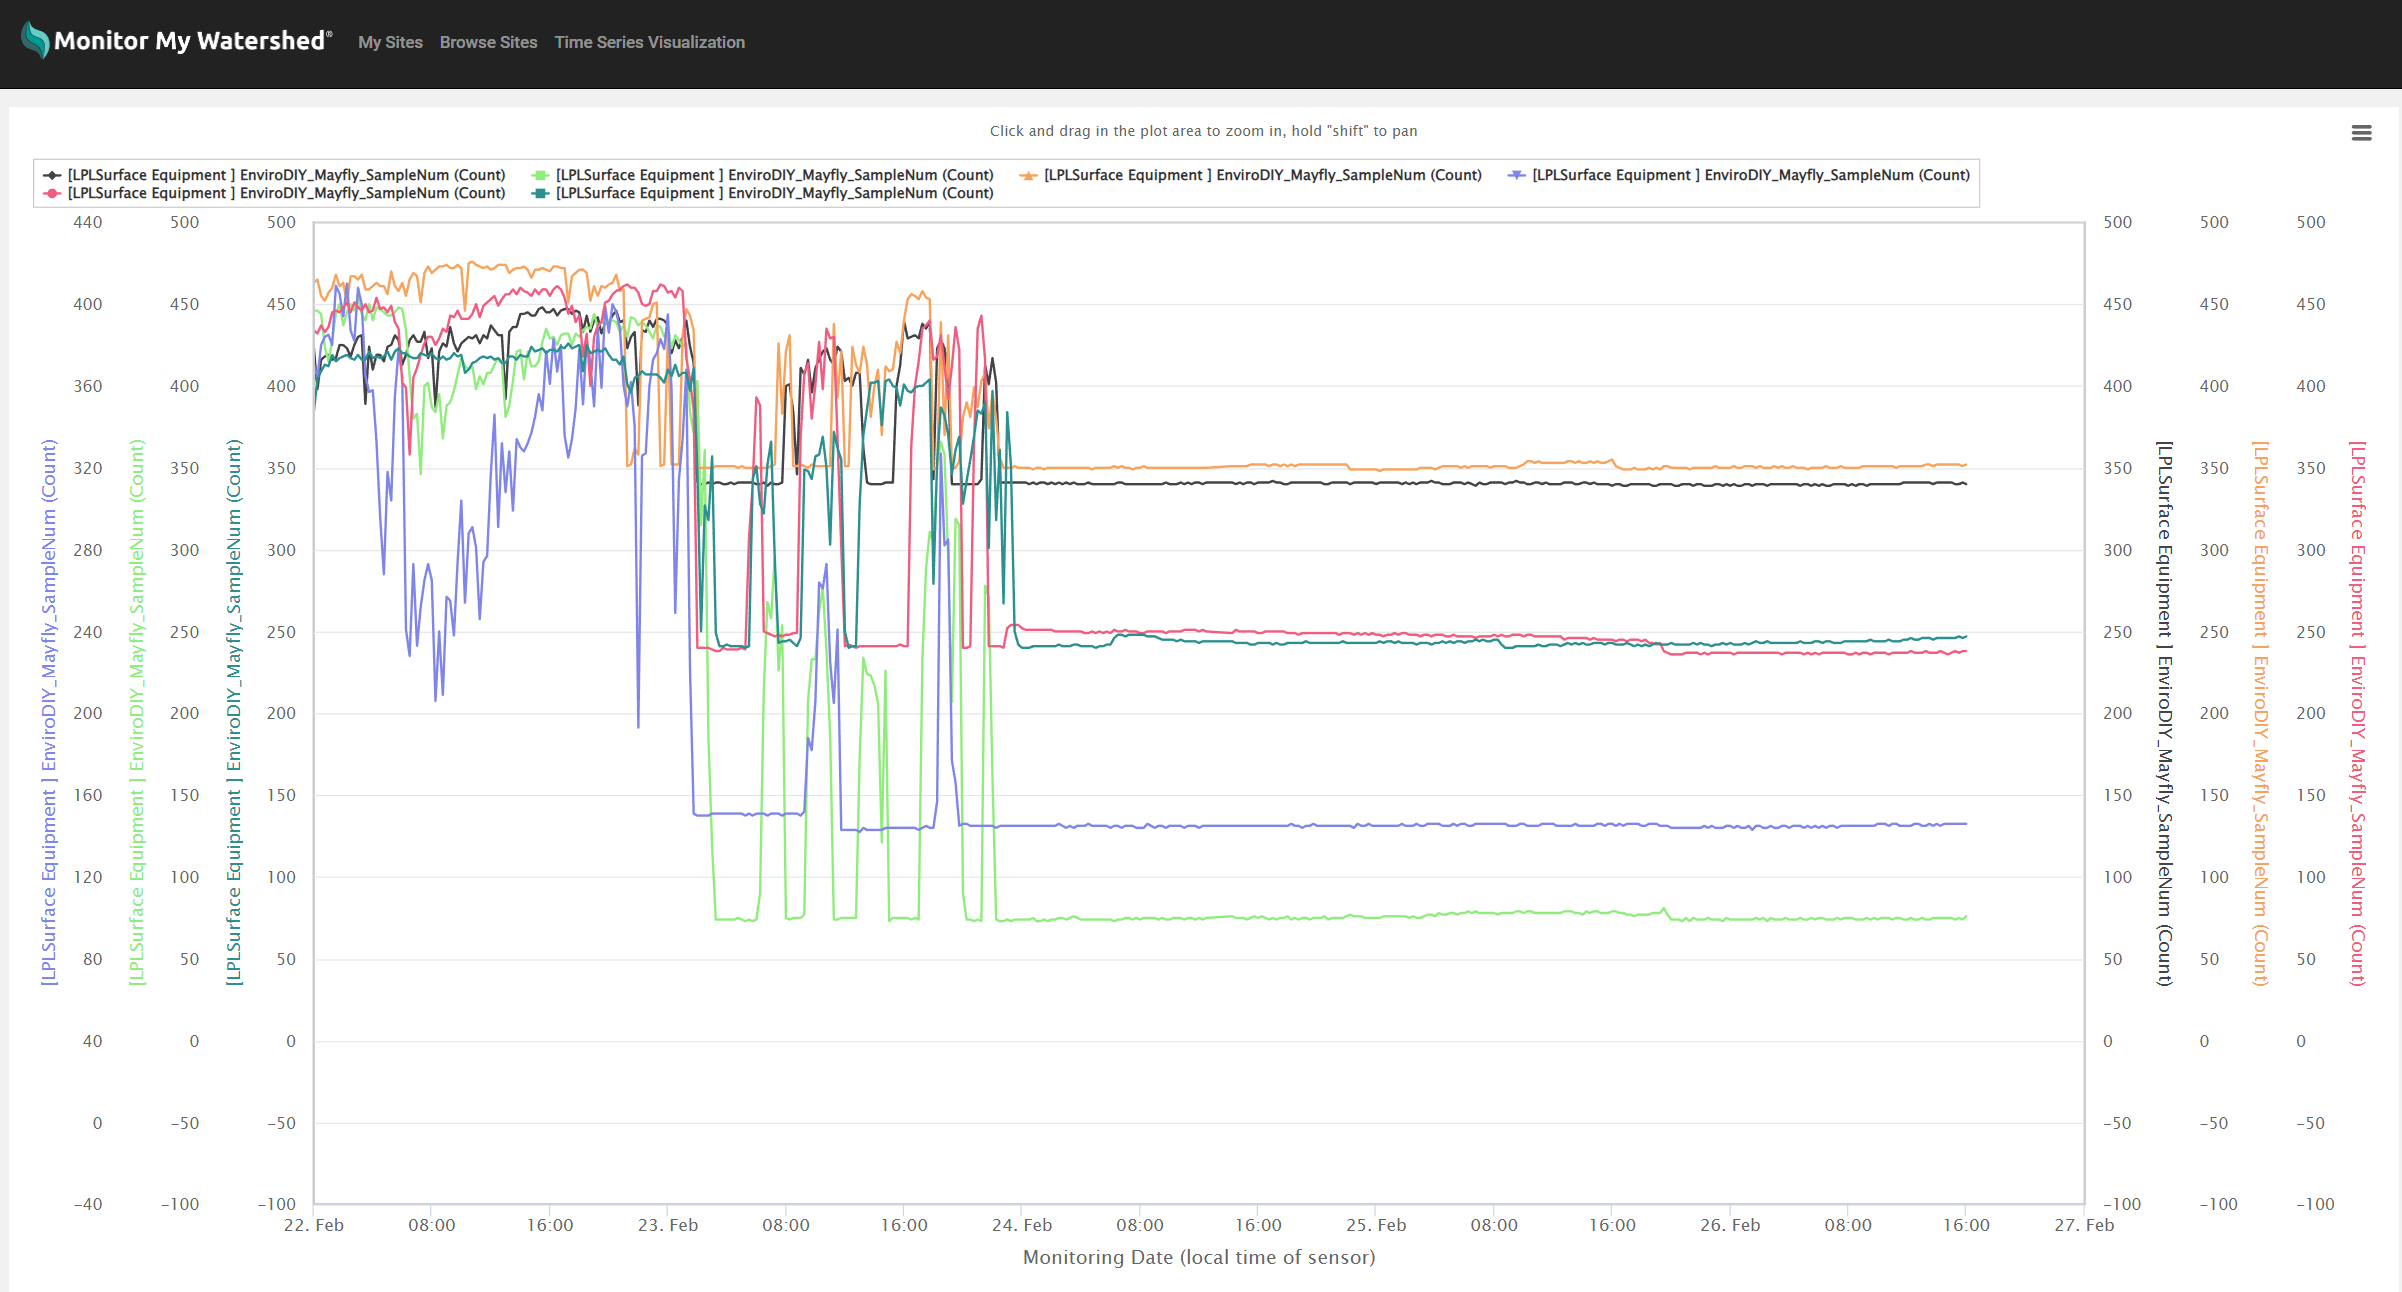
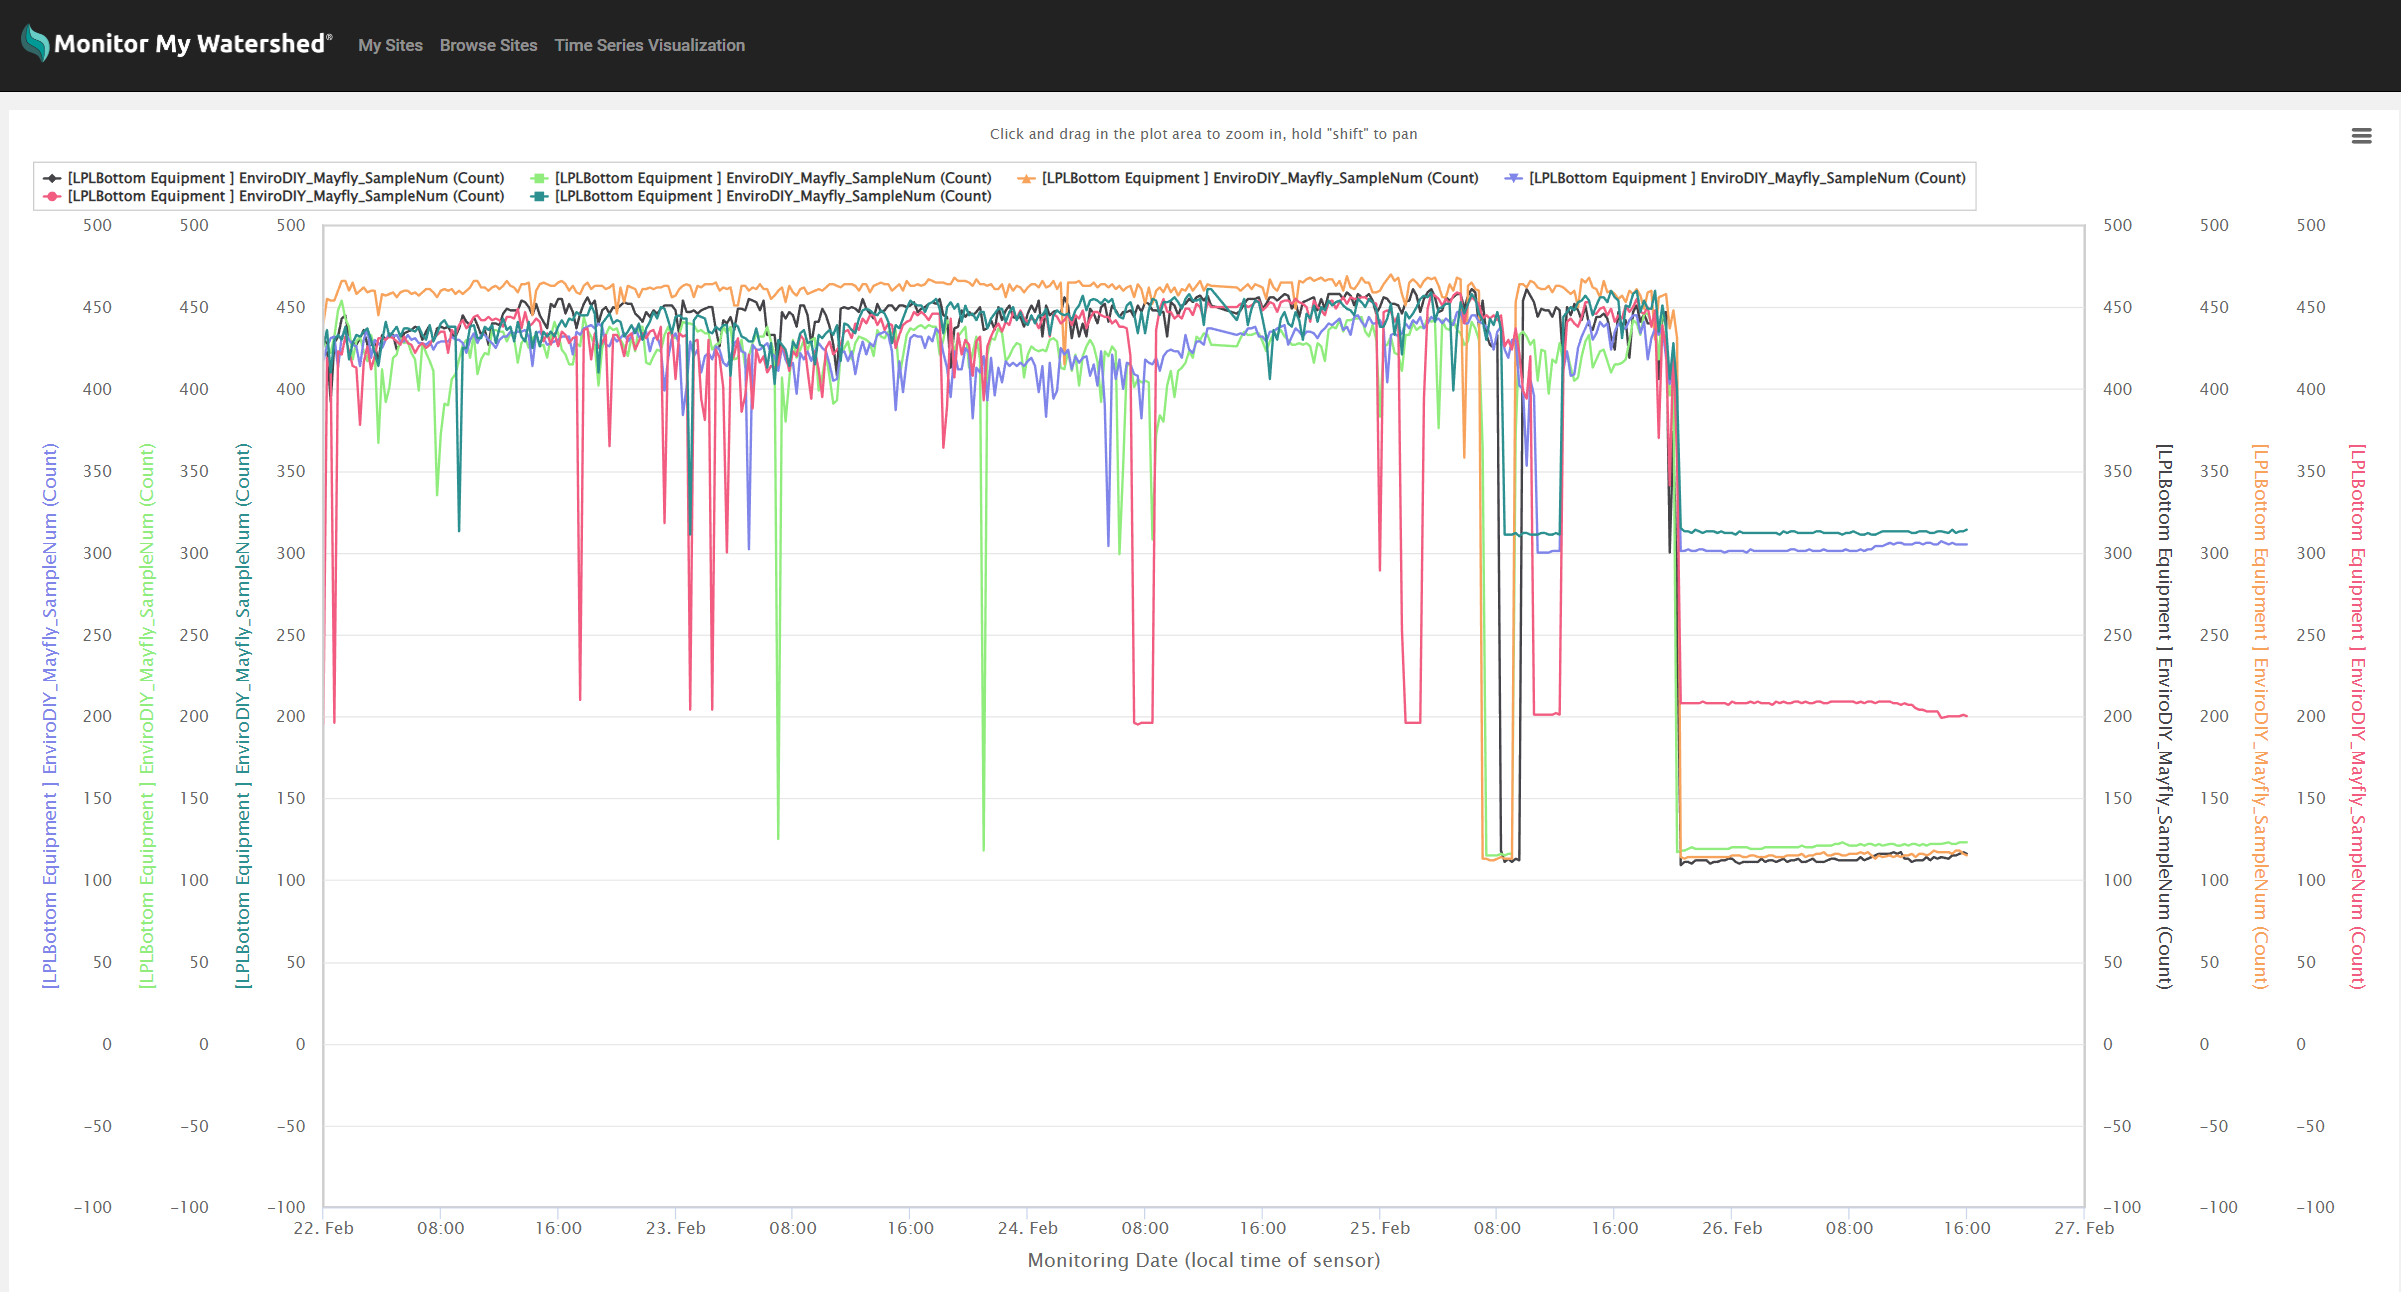
The two screenshots below show timeseries visualizations of oyster openings and closings at both a surface and bottom mooring at one of the project sites, Los Penasquitos Lagoon, over a period of 5 days. During the final few days of this time period, the estuary accumulated freshwater and the surface animals closed on Feb 24, several days earlier than the bottom animals, and stayed closed (closure is represented by the low values). The bottom oysters mostly remained open (high values) up until Feb 26, when the estuary mouth opened and freshwater started flushing through the entire water column out to sea. They reopened in the following days after freshwater flows subsided and the tide started flowing back into the estuary regularly.
Surface Mooring:
Bottom Mooring:
Data retrieved from temporary storage on Monitor My Watershed. https://monitormywatershed.org/